Compare an item's recent market and its suppliers
Video sections for this page
- 0:00 — Open NSN Market Analysis
- 0:13 — Choose one search route
- 0:35 — Search by National Stock Number
- 0:58 — Read the company row
- 1:14 — Search by company CAGE
- 1:37 — Open the unique-NSN list
- 1:54 — Move through the NSN pages
- 2:07 — Find candidates by product name
- 2:30 — Open one candidate’s market report
- 2:55 — Return or clear the search
- 3:11 — Read each measure by its heading
Application path: Main Menu → NSN Market Analysis 3 years.
Use the market report to review the displayed fiscal-year buying totals for an item, or to investigate a company's parts activity. Start with the question you want to answer: a particular stock item, a known supplier, or an item name.
The screen provides three separate search fields: Company CAGE Code, National Stock Number, and Product/Part Name. Enter information in the matching field and use its adjacent search action. For a product or part name, choose Find NSNs to display matching stock numbers. Reset Form clears the three search fields and the displayed report or list values while keeping you on the Market Analysis page.
Research a known NSN
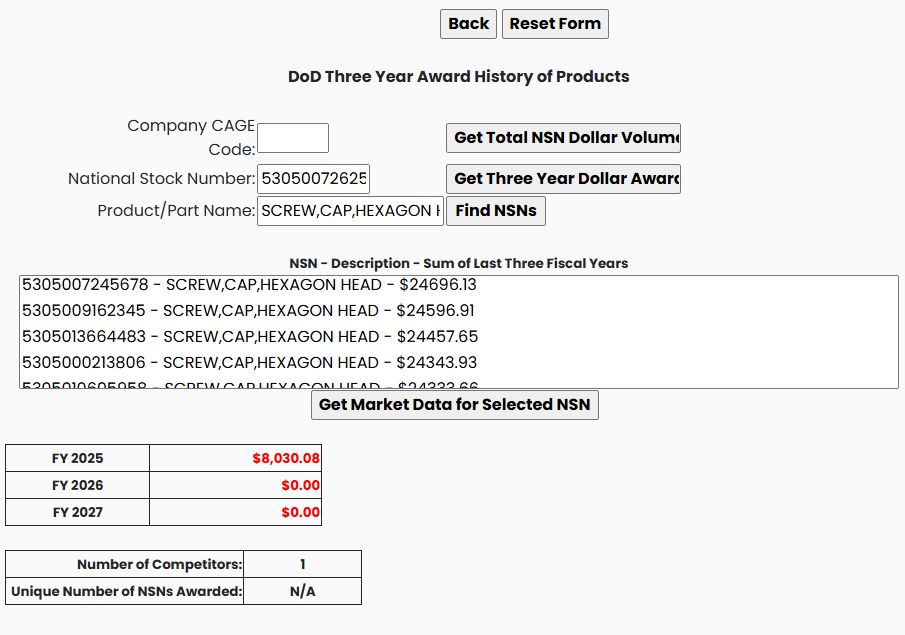
Enter 5305007262550 in National Stock Number and run its adjacent three-year award search. In the October 21, 2026 example, the report shows $8,030.08 for fiscal year 2025, $0.00 for 2026 and 2027, and 1 competitor. The screen also shows N/A for Unique Number of NSNs Awarded in this item-level example.
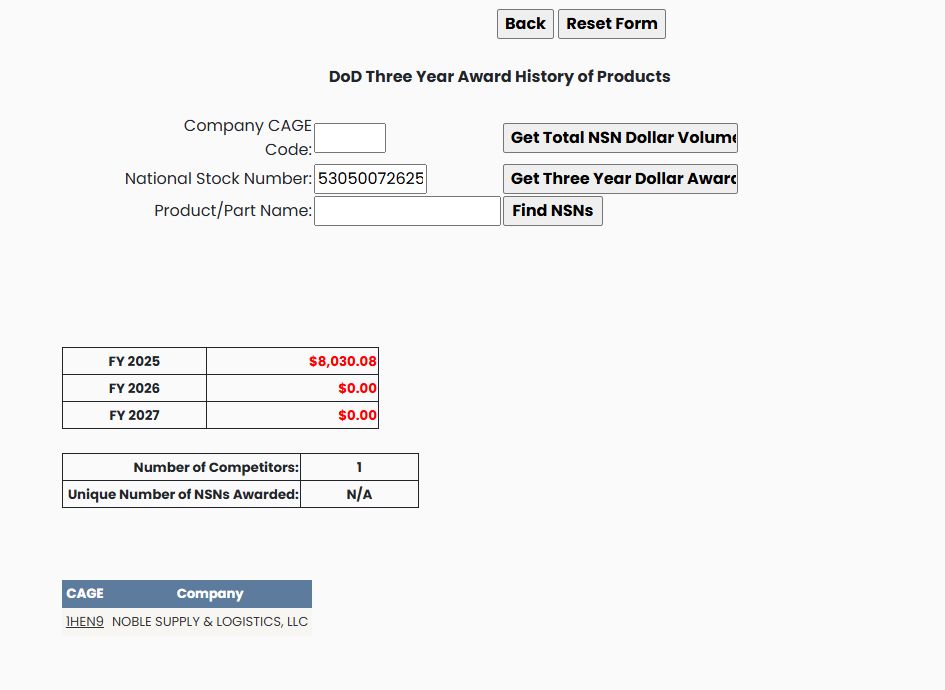
Read each amount under its fiscal-year heading. The displayed company row identifies NOBLE SUPPLY & LOGISTICS, LLC, CAGE 1HEN9. The report also presents separate controls for Back and Reset Form; use the field labels and visible report headings to keep each result with its search.
Research a known supplier
Open NSN Market Analysis 3 years from Main Menu for a fresh search. Enter 1HEN9 in Company CAGE Code, leave the NSN and Product/Part Name fields blank, and use Get Total NSN Dollar Volume.
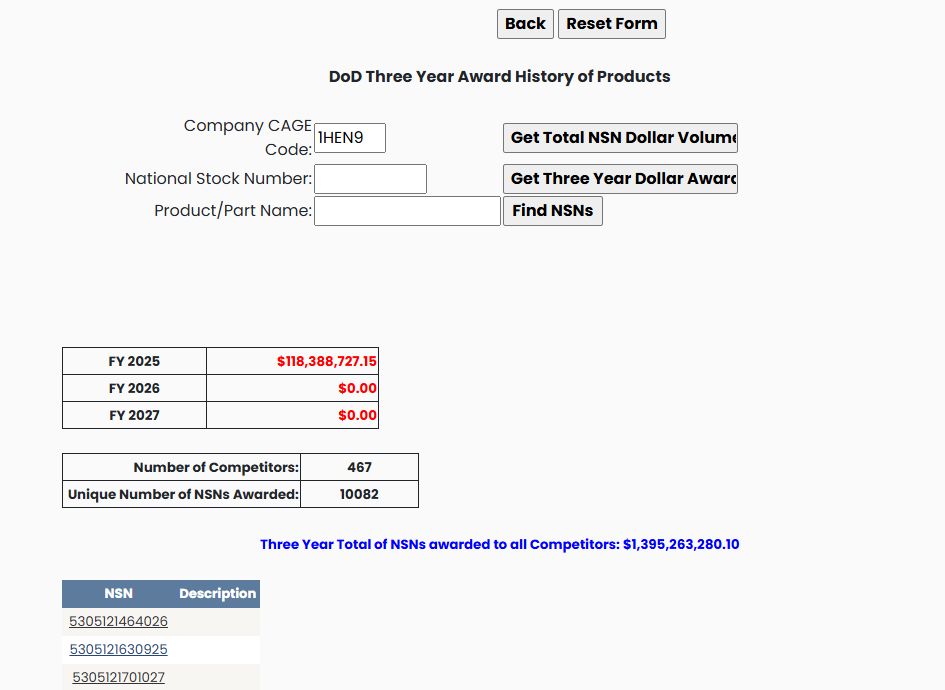
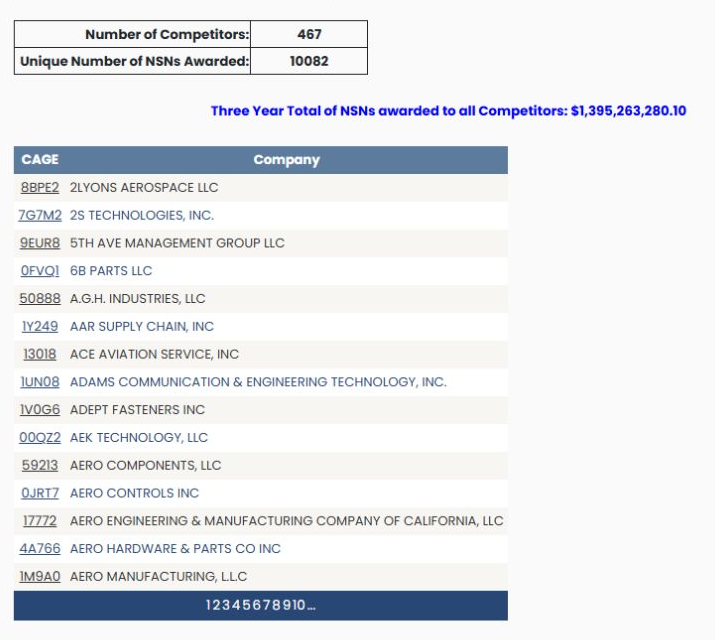
The example displays $118,388,727.15 for fiscal year 2025, $0.00 for 2026 and 2027, 467 competitors and 10,082 unique NSNs. It also displays Three Year Total of NSNs awarded to all Competitors: $1,395,263,280.10. These are separate displayed totals; read each with its own label. Select the 10,082 unique-NSN count to open the item list.
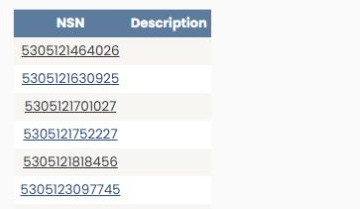
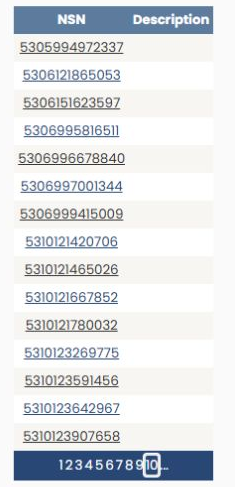
The list has NSN and Description headings. In the saved view, the visible rows show linked NSN identifiers and blank Description cells. The list shows 15 rows per page; its headings can sort the list, and numeric page links move between pages. Page 2 keeps the same two-column layout and shows a different set of stock numbers.
Select the linked 467 under Number of Competitors to switch the lower table to CAGE and Company. It shows 15 companies per page, with numbered page links. In this example, the first row is 8BPE2 — 2LYONS AEROSPACE LLC. Select that CAGE to open its company profile; Back returns to the market report. Select 10,082 to show the NSN list again.
For a full item example, continue with the verified 5305007262550 lookup in the Search by NSN/NIIN guide.
| Displayed item | What it tells you |
|---|---|
| Fiscal-year amount | The amount shown for that year's column and the selected research subject. |
| Number of Competitors | The competitor count displayed for the result. The cap-screw example shows 1. |
| Unique Number of NSNs Awarded | The displayed unique-item count; for CAGE 1HEN9, 10,082 is a link to an NSN/Description list. The cap-screw item example displays N/A. |
| Three Year Total of NSNs awarded to all Competitors | The comparison amount displayed for all competitors in the CAGE example. Read it separately from the selected company's fiscal-year amounts. |
For the item description, commercial part references and detailed research buttons, continue with the NSN item guide.
Find matching NSNs by product or part name
From Main Menu, open NSN Market Analysis 3 years. Enter a product or part description in Product/Part Name, then choose Find NSNs. The example below searches for SCREW,CAP,HEXAGON HEAD and returns a list headed NSN - Description - Sum of Last Three Fiscal Years. The saved view reports 4,963 matching options. The list is scrollable; the capture shows its headings, first rows, and Get Market Data for Selected NSN action. Select an NSN and choose that action to display its item report.
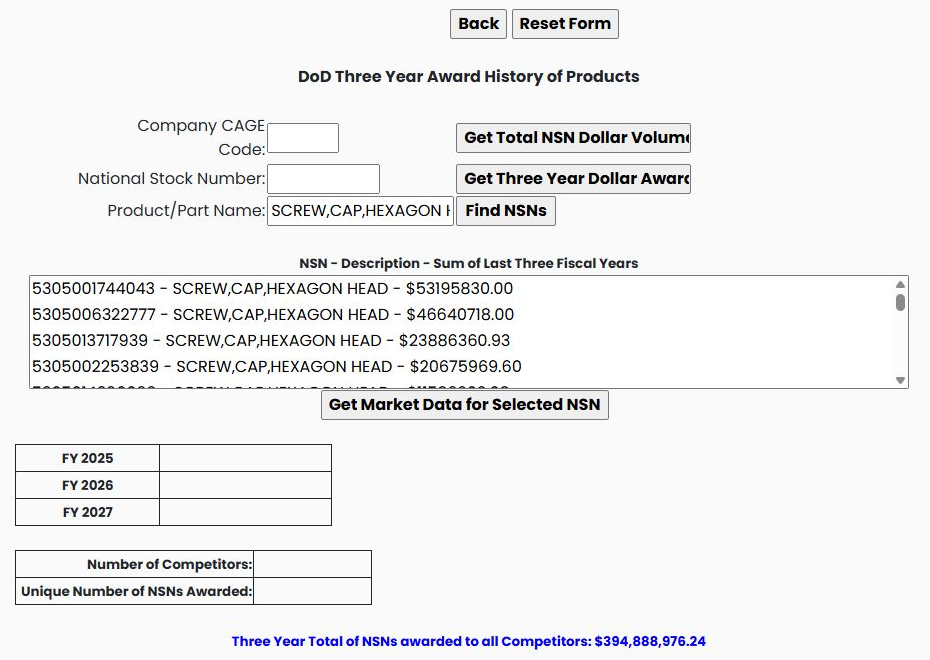
The list is useful for identifying matching stock numbers. Selecting 5305007262550 and choosing Get Market Data for Selected NSN opens its item report, which shows $8,030.08 for 2025, $0.00 for 2026 and 2027, and 1 competitor. The product-name list shows a separate Sum of Last Three Fiscal Years value of $24,305.28 for that NSN. For this example, the list amount combines 2023 ($12,795.20), 2024 ($3,480.00), and 2025 ($8,030.08). The selected report displays a different three-year window, 2025–2027, so the two totals are not directly comparable. Back hides the product list and returns to the report form with the product-name entry retained. Reset Form clears the entries and displayed report/list values.
Continue from the unique-NSN list
Select an NSN in the unique-item list to research that item. The following walkthrough uses its own recorded supplier and brake-shoe example to show the list-to-item continuation; keep those example values separate from the NOBLE figures above.
Watch: Open an item from a supplier market-analysis NSN list